Plotting Signals
Here are a few simple utilities to convert raw datafiles into
a format you can read and plot w/ gnuplot.
raw2num.c - converts a file of 16 bit shorts into a numerical
human readable file with an index. Used for files created with
gr.file_sink (gr.sizeof_short, "datafile")
Usage $./raw2num <input_file> <output_file> <offset> <number_of_numbers>
raw2num_f.c - converts a file of 4-byte floating point numbers into
a numerical form with an index.
raw2num_fc.c - converts a file of 4-byte float complex pairs into
numerical form.
sign2unsigned.c - converts a signed short file, numbers in the range of -32768 to +32767, to unsigned 0-65535, with the former 0 at 32768+bias. For example, my ADC creates numbers from 0-4095 with signal zero at 2048. When I create a signal file with gnuradio I can convert from it's signed format to unsigned with the 0 level at 2048.
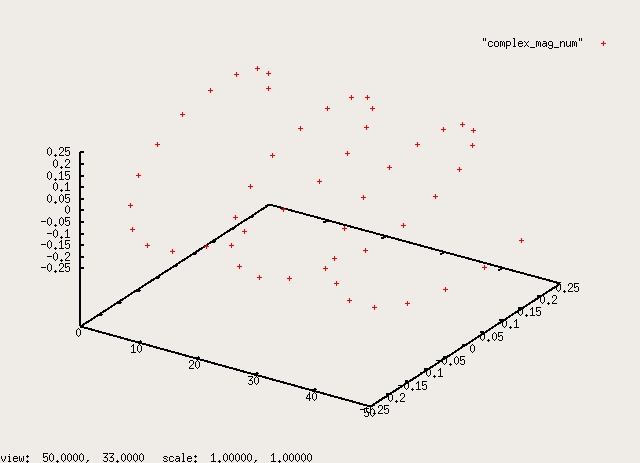
New: To view complex data in 3D form try 'splot' in gnuplot.
gnuplot>set xrange[0:50]
gnuplot>splot "complex_mag_num"
Then click and drag to rotate and look at the corkscrew from different angles.
Usage - start gnuplot. At the gnuplot> prompt type
gnuplot>plot "file"
will display the converted short or float file. Change the x-axis range
with
gnuplot>set xrange [0:512]
gnuplot>plot "file"
For example, to use gnuplot like an oscilloscope for dial_tone.py, a
version which adds both 350 & 440 hz into one channel
Briefly run $./dial_tone_2.py and hit enter to stop it. There will be
a data file "dial_tone.dat" of float data. Convert to numerical with
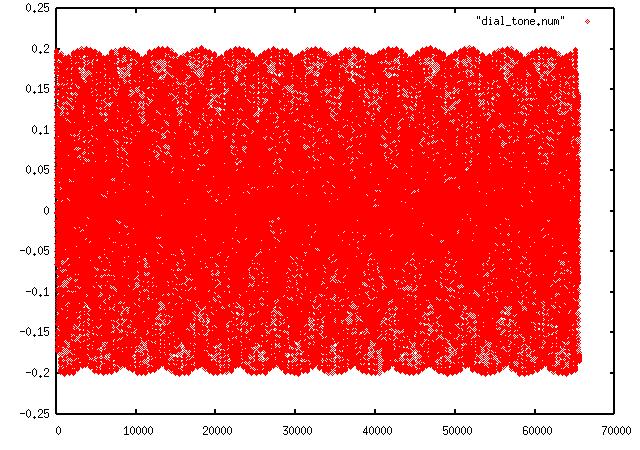
$./raw2num_f dial_tone.dat dial_tone.num 0 65536
then display with gnuplot.
$gnuplot
gnuplot>plot "dial_tone.num"
and get a display like this:
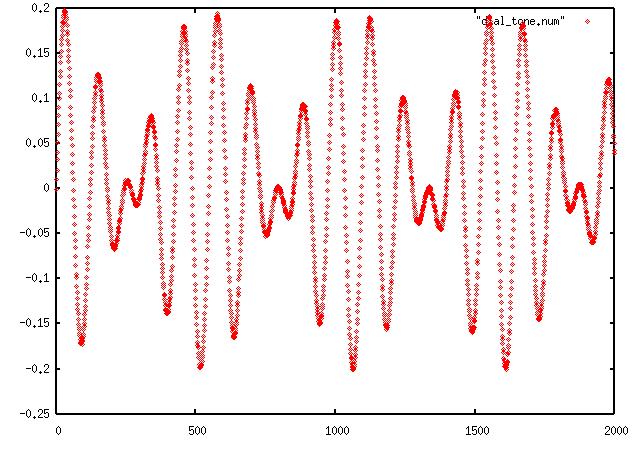
Finally focus on a small area of the waveform with
gnuplot>set xrange [0:2000]
gnuplot>plot "dial_tone.num"
and get a plot like this:
For complex float output your have to run gnuplot with 'using'. For
example, this program creates a complex signal
Run this briefly and get a complex float data file dial_tone_c.dat. Convert to numerical with
$./raw2num_fc dial_tone_c.dat dial_tone_c.num 0 65536
Then plot with
$gnuplot
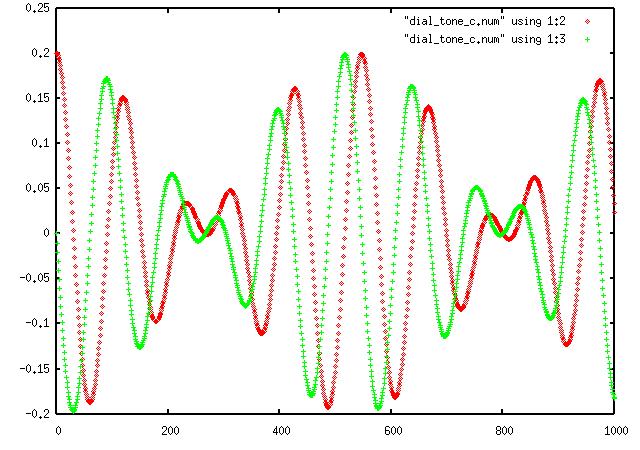
gnuplot>set xrange [0:1000]
gnuplot>plot "dial_tone_c.num" using 1:2, "dial_tone_c.num" using 1:3
That creates one plot using columns 1 and 2, the imaginary part of the complex signal, and another plot using columns 1 and 3, the real part, so you get a plot like this:
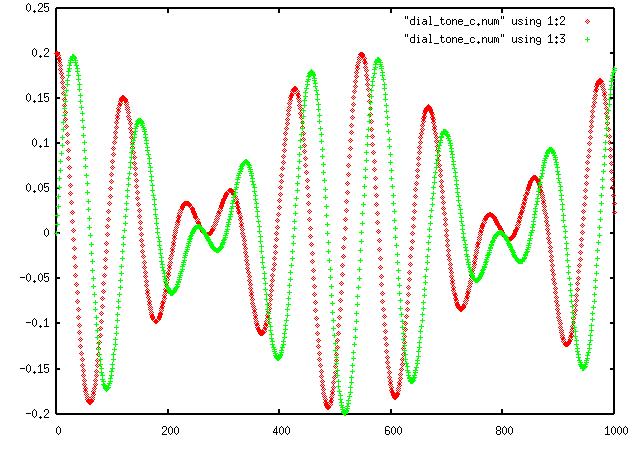
Notice the 90 degree phase shift between the real and imaginary plots. Change the frequencies to negative in the above script, repeat and notice the change in phase to this