Phase measuring experiments
This script is the cumulation of experiments toward learning
how to measure the phase between two signals at the same
frequency. I was at a loss of how to do this untill reading
the excellent tutorials on costas loops by Eric Hagemann
on this
page. After reading about phase-lock-loops it became
somewhat obvious: you mix the two real (not complex) signals and low-pass
filter. If they're the same frequency, f, you end up with 2f
plus a DC component indicative of their relative phase with
some ambiguity (as we'll see shortly). One thing that is appearent
is the magnitude of the signals matter, as simply changing
the magnitude of either signal will change the filtered phase
signal. So that was an opportunity to experiment with
measuring signal strength and setting an amplifier gain to
compensate.
The math of mixing two signals of equal frequency and differing phase:
sin(wct + φ) * sin(wct + θ) = ½ [ cos ( φ - θ) + cos( 2wct + φ + &theta) ]
where you can see there's a double frequency term cos( 2wct + φ + &theta)
which gets filtered out, and the remaining term is simply the cosine of the
phase difference - which matches the lab here when the two signals are in
phase cos(0) = 1, and when 180 degrees out of phase cos(180) = -1. This also
explains why it is difficult to accurately measure phase near 0 or 180
compared to 90 or 270 degrees - a small change of phase near 0 or 180 makes
a smaller signal than the same change near 90 or 270.
This script no longer needs custom signal blocks. Instead, a sink called
gr.probe_avg_mag_sqrd_X(1,.001) is used from the official gnuradio source.
X=f for float or c for complex.
probe_avg_mag_sqrd_X takes an 'alpha' argument (plus an usused 'threshold'
left over from squelch) for an iir filter, and reports the signal
strength:
>>>meter = gr.probe_avg_mag_sqrd_f(1,.001)
>>>print meter.level()
12.509
The value 'm' returned by meter.level() is the magnitude squared divided by 2. Since the
amplitude 's' of a signal from gr.sig_source_f() is PEAK, the relation between
the two is: m=(.707s)**2, or s=sqrt(2m). That is, if a float source has an
amplitude of 1, meter.level() returns .5 = (1**2)/2. If the source is 2, m=(2**2)/2
or 2. If s=8, m=(8**2)/2 or 32 etc. If we use meter = gr.probe_avg_mag_sqrd_c(1,.001) for
a complex signal, the result returned by meter.level() is the peak squared, m=s**2.
That will be important in setting the gain of an amplifier to normalize
the amplitude of the two signals before measuring their relative phase.
As far as I can tell the iir 'alpha' is a trade off between frequency and
processor usage. Generally smaller is better, but more expensive, and
it doesn't pay to use too small for a given frequency. All I know is to
used trial and error so that the measured signal strength at the highest
frequency measured doesn't bounce around too much. gr_signal_level2_ff.cc
is for reading the DC phase shift signal and eleminates the iir filter.
The experiment flow graph:
sample freq = 1e6
signal freq = 1e4
signal ampl = .1

        +----(i_meter)
        |
        +----(oscope, 0)
        |
(src0)--+---------------------------------------------------+
        |                                                   |
        +----(src1)-----(mul2)---+---------------(X)--+----(X)---->A
             phase     amplitude |               pga  |    mul1
             shift      change   |                    |
                                 +----(oscope 1)      +---(oscope 2)
                                 |
                                 +----(o_meter)

                +----(meter)
                |
   A>---(lpf)---+----(oscope 3)
         x20
In the above, the signal source, 10Khz at 1Mhz sampling rate, is fed
to our oscilloscope channel 0. It is also measured in amplitude at
i_meter and fed to the phase multiplier. It is also altered in
phase and amplitude (controllable by sliders in the gui) by src1
and mul2. The phase shift is controllable from 0 to 99 samples, which
translates to 0-356 degree delay for a 10Khz signal sampled at 1Mhz.
The altered signal is fed to scope channel 1, is measured
by o_meter, then normalized by pga using a formula on the measured
values from i_meter and o_meter. Specifically
pga.set_k(math.sqrt(i_meter.level()/o_meter.level()))
The normalized signal is display in scope channel 2. Then the normalized
phase-shifted signal is mixed with the original signal in mul1, then
low-pass filtered, measured and displayed in scope channel 3. The low-pass
filter has a gain of 20 so the relatively small phase signal will show up
on the same scale as the source signals. The measured values is updated
in a text window in the gui every 100mSec, and the pga is also set
every 100mSec to compensate for any changes to the amplitude slider.
The lab is more fun to play with using a Powermate knob to adjust the
phase.
Here is the final script.
This is the display when first run:
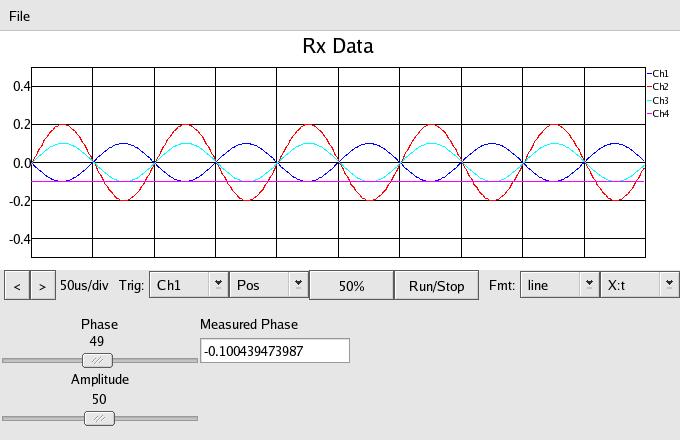
The blue line is the original source signal, red is phase shifted or
delayed 180
degress and amplified by 2 (the amplitude slider is zero to 100/25, or
0 to 4). The cyan curve is the normalized in amplitude signal, attenuated
in pga to match the original signal. Finally the purple line at the bottom
is the final phase measurement, -.1
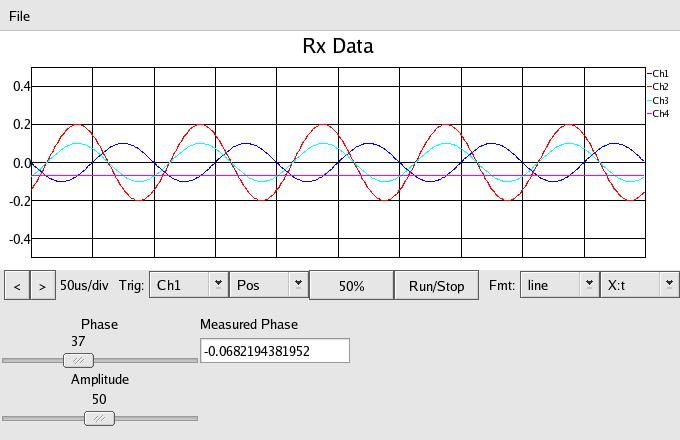
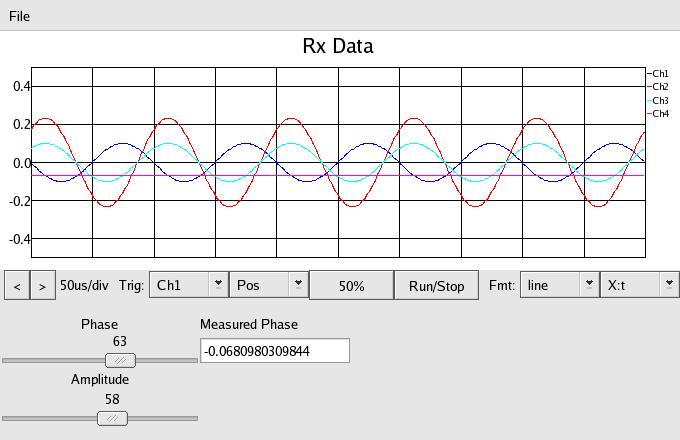
In the above we have changed the delay from 180 to 135, so the measured
phase signal is now -0.068
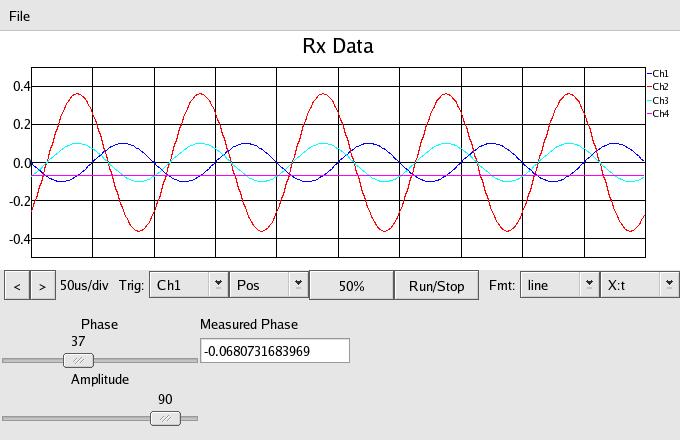
In the above we have increased the amplitude. As you can see, the i_meter,
o_meter and pga have returned the cyan signal to .1 to match the original
signal, and the measured phase signal is still -.068 for 135 degrees, even
though the magnitude has changed.
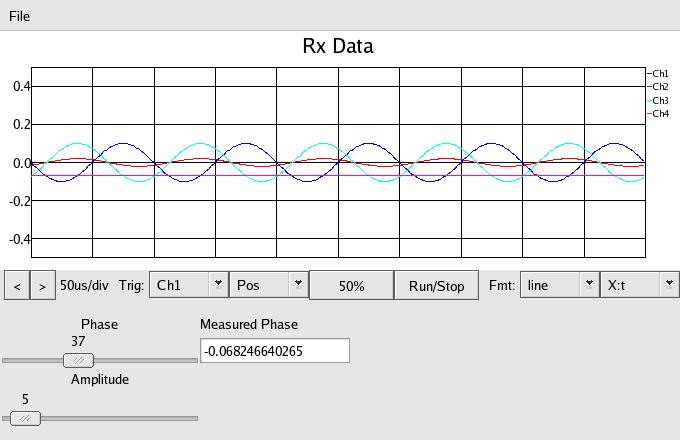
Now the amplitude has been reduced to .02, and still the normalized
signal matches the original, and the phase signal is still -.068
Now we've changed the phase to 225 degrees delay (symmetrical by 45 about
180) and the measured phase is still -.068 - that's the ambiquity mentioned
above. To resolve the ambiguity in the final project, we will measure
the phase shift of the device under test with two signals 90 degrees
apart. That will tell us exactly what the phase actually is.
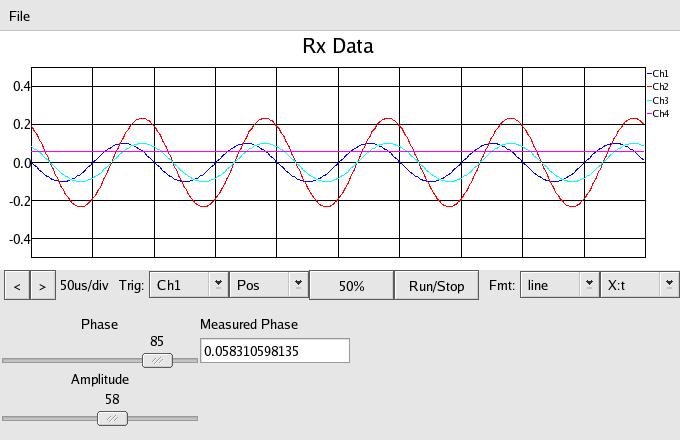
Lastly this is the signal delayed by 306 degrees, and the measured
phase shift is 0.058