Experiment #5: series RLC circuit
This verification experiment uses the 1nF capacitor and the 1.5uH
inductor connected in series with a 51 ohm resistor
to the VNA on a breadboard and the 6" piece of RG-174.
I use the same calibration data files from experiment #1.
Then I run f_sweep_tr.py stopping at 10Mhz.
This creates a data file RLC_series_refl_raw. This is compensated with
$ ./refl_calc_1.py calib_refl_open calib_refl_short calib_refl_load RLC_series_refl_raw RLC_series_refl_comp
and then display the results by converting from polar to rectangular form with
$ ./convert_rpt_to_smith3.py RLC_series_refl_comp RLC_series_refl_comp_smith
then putting the filename into smith_chart and
plotting with gnuplot: $ gnuplot smith_chart
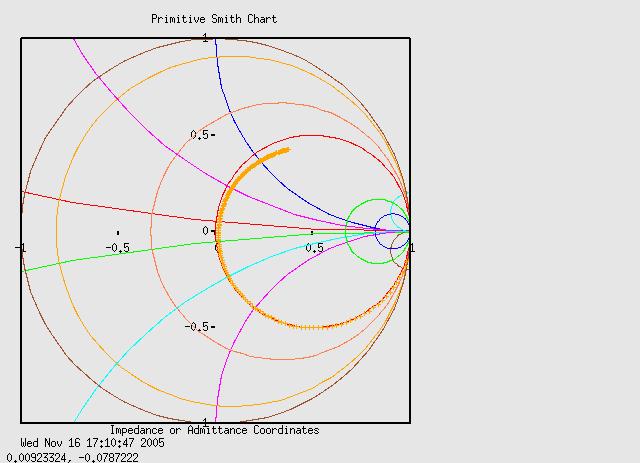
A series resonant RLC circuit appears as a low impedance where inductive reactance
equals capacitive reactance. This time at resonance the 51 ohm resistor makes
a near perfect match to the 50 ohm transmission line and reflection is near
zero, at the center of the graph, at about 4.15MHz. Interestingly the curve
follows the normalized R=1 (or R=50 un-normalized) circle. Also, I've noticed
in many test runs that an inductors resistance increases at higher frequencies.
That explains the turning in from the R=1 circle near the top. However I cannot
explain why the appearant resistance increases in an inductor. Skin effect?
At 1MHz, R=48.76 and slowly increases to 51.37 ohm at f=4.15MHz - it is a
51 ohm resistor (5%). However at 9.9MHz R increases to 59.34 ohms. Look at
the value of R in experiment #1 (the 1.5uH inductor) - it is 8.45 ohms at 10MHz,
and only 1.5 ohms at 4.15MHz, and 0.129 ohms at 1Mhz.