Smith Chart Display
This is my favorite useful script for working with adjusting antennas
as it gives a real time display of the system for a single frequency.
It also includes calibration and compensation routines, so before
hitting the "start" button you setup an "open" at your reference
plane, hit the "open" button, repeat for "short" and "load". Then
hit the "start" button and get a Smith Chart display updated 4
times a second. There is a control for small adjustments in test
frequency, keeping in mind that any big change in frequency would
require recalibration.
This came in very handy in getting a receiving loop antenna to work
for low power transmission. I connected the loop up to this instrument
(after calibrating) and turning the tuning capacitor I could see
a small dip in reflection magnitude but it never went to zero,
which would be a very small line in the center of the display. I used
the antenna for receiving and get a sharp peak in signal strength
for a given frequency with the tuning capacitor. Almost by accident,
I put my hand across the tuning capacitor and noticed the reflection
power drop way down. trying a 1k resistor across the cap it was
better than before, then with a 4.7k resistor the tuning cap would
tune it down to near 1:1 swr! At that point my goal of building a small 3ft
square antenna capable of transmitting a few milliwatts of AM broadcast
band signal about the apartment was realized, tuned and with 50ohm input.
Here is the Smith Chart display after calibration and with a short at
the reference plane:
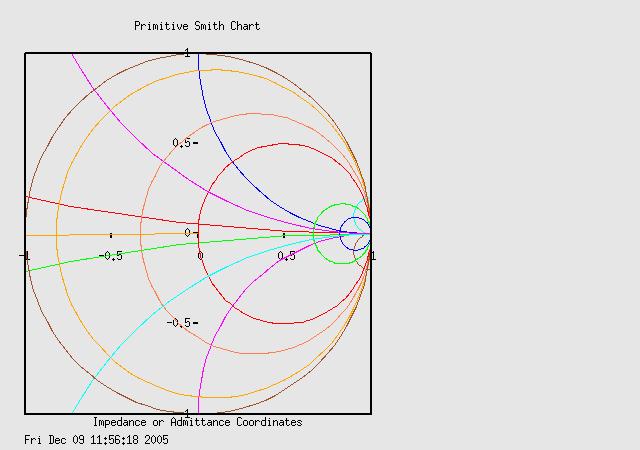
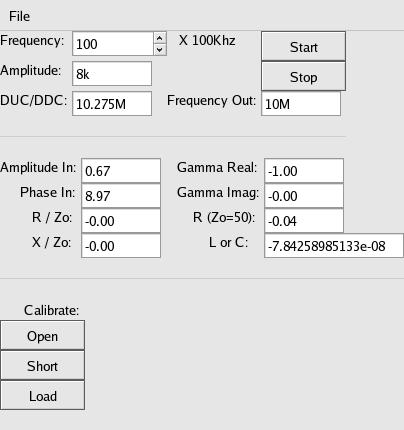
Notice the gamma is perfect for a short: -1+j0.
The code: smith_chart_5a.py
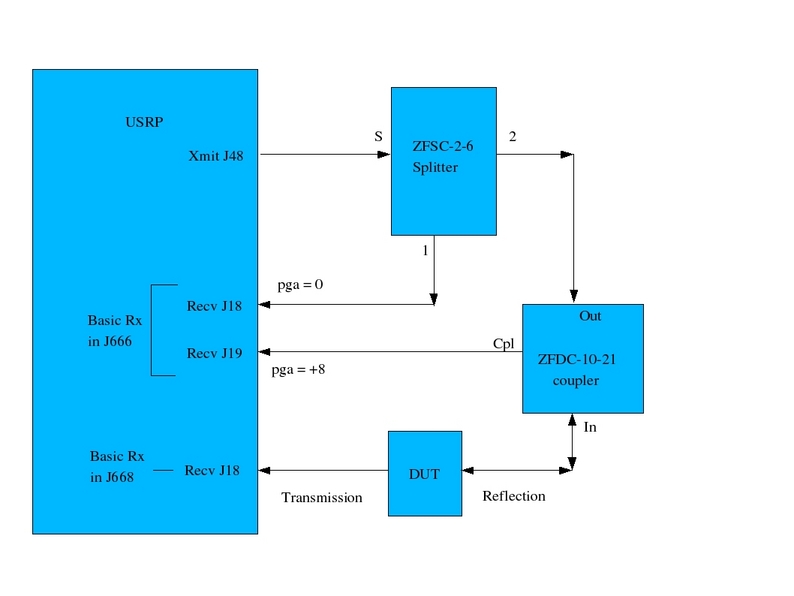
The hardware setup is the same as earlier projects: