Analyzing a 40 Meter Hamstick


This antenna was already tuned and used on about 7.1Mhz for psk31. It's on my back deck at the end of 50ft of coax. Interestingly, while trying to calibrate the VNA for 'open' transmission line, with the 50ft RG-58 connected to the VNA but open at the antenna end, I get this:


which must have something to do with wavelength, coax length, and location of standing wave maxima and minima. There's over 90 degree phase shift when swept over 6Mhz to 8Mhz. Moving on, the Hamstick phase response:


and it's magnitude response:


Which looks very good, right on target for 7.05 to 7.1Mhz. I recalibrated the VNA for open/short/load on a Smith chart without the 50ft coax, and then got this for the Hamstick:


Where 6Mhz is the point of the far right, looping thru 0 around 7.05-7.1Mhz, and ending up at the bottom at 8Mhz.

Just to explore the earlier phenomenon, here's the open ended 50ft RG-58 swept from .5 to 25Mhz:


What the above chart shows is 1) increasing loss with frequency, which is why the reflection magnitude spirals in, and 2) the open circuit/infinite impedance being transformed as the electrical length of the transmission line changes with the increasing frequency. A 1/4 wave line transforms the impedance into it's reciprocal. For example, using a 1/4 wavelength transmission, taking into account the velocity factor, an open is transformed into a short, and a short to an open circuit.

Here is a little better plot. Using a velocity factor of .66, one full wave on 50ft of RG-58 should appear at around 13Mhz. Here is an open 50ft length of RG-58 coax swept from 2 to 15Mhz. Again, the red line is the magnitude of the reflected wave, green the phase between the applied and reflected wave, and blue the phase between the applied wave advanced by 90 deg and the reflected wave:

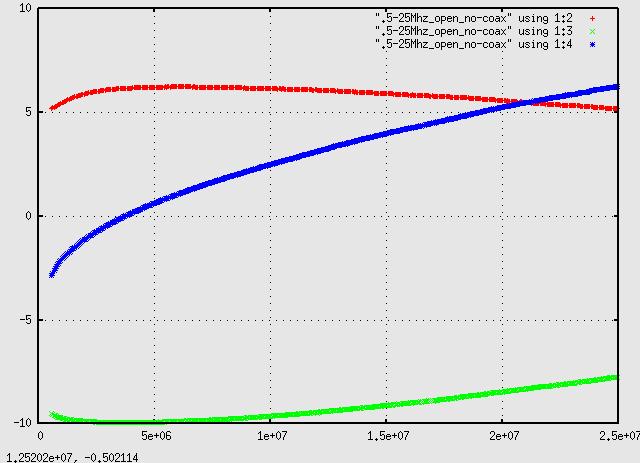
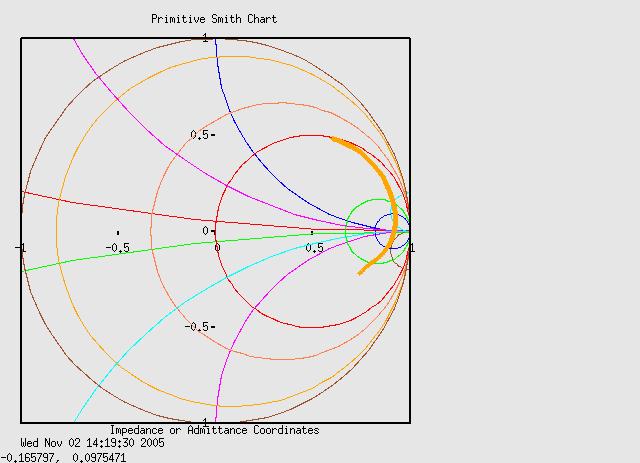
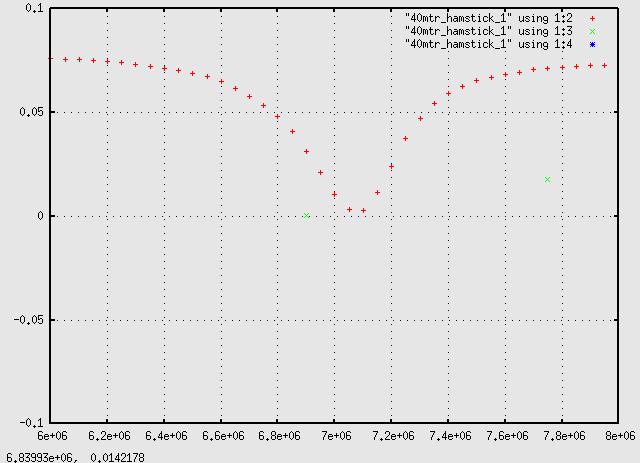
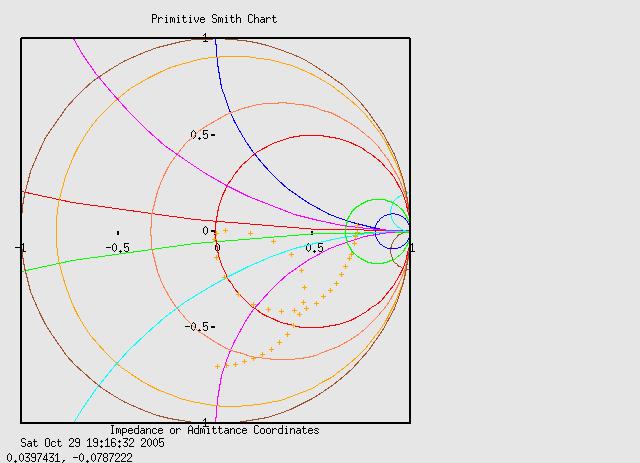
where it looks like an in-phase voltage node appears just above 15Mhz. Going from the other peaks it's 15.15Mhz. And here is the same data run thru a Smith chart converter:


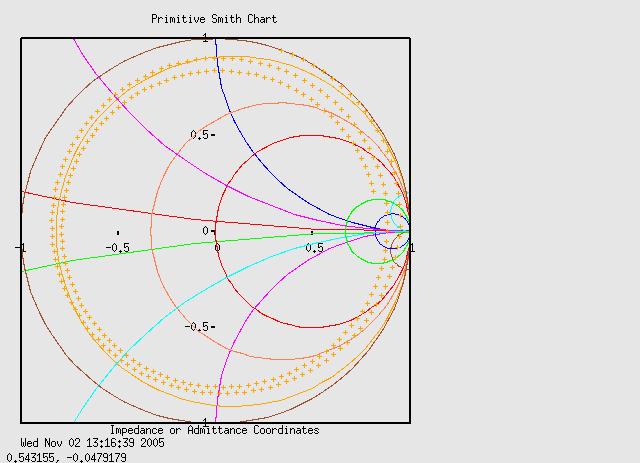
This is a better plot than the earlier once as it does away with the errors due to cos(acos(x)) - the 'gaps' in the circles. I was pleased to see we can use the +90 deg phase shifted reference signal, used to resolve the sign of the angle, to go directly to a polar plot! The following script can be used to convert reports generated with f_sweep_2.py to Smith charts.

To use it, reference the output in smith_chart like:
cu(t,.5),cv(t,.5),cu(t,.5),-cv(t,.5),\
tu(t,0),tv(t,0), "YOUR_DATA_HERE" using 2:3
pause -1
where YOUR_DATA_HERE is the converted output filename, then just run
$ gnuplot smith_chart


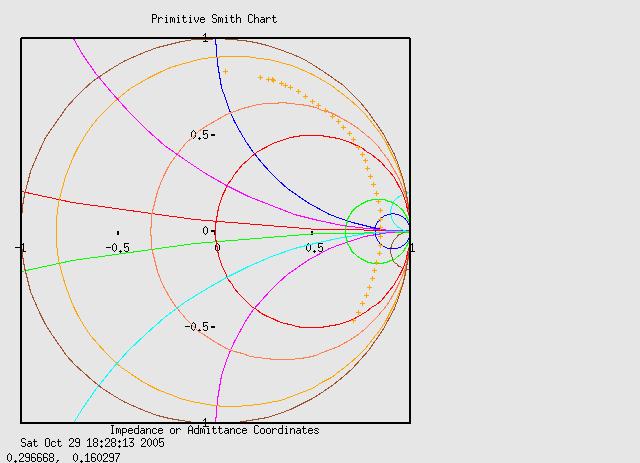
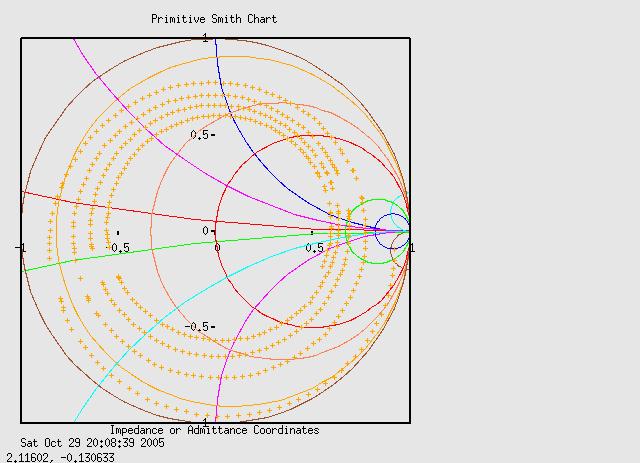
Unfortunately this is all still uncalibrated. Shortly I hope to have some tables of frequency dependant error corrections for test jig open/short/load ready to go and do some real measurements.

In the meantime, these are just two charts of the test jig with no cables connected, the ZFDC-10-21 'in' port unconnected, .5 to 25Mhz: