Automatic testing with Magnitude and Phase plotting
This is an extension of the scalar analyzer to include the
phase response of the device under test (DUT). The results appear to be
relatively correct but I have not yet calibrated them absolutely.
The only hardware required is a USRP with one basic TX and RX
board, and something to test.
We measure a DUT by comparing it's response to a referance channel, a coax cable.
The referance channel is a 2 ft long RG-174 with sma connectors
connected from J49 to J18. The DUT is connected with two
shorter pieces of RG-174 between J48 and J19. At the low frequencies
used (below 30Mhz, wavelengths longer than 10 meters) a few
inches difference is negligible.
A single software signal source is swept over a 600Khz band and sunk into
the usrp, upconverted and transmitted from the basic TX board. This one
signal makes a quadrature output on J48 and J49. When
the two signals, either directly connected or thru a DUT, are downconverted
(what is it's effect on phase?),
equalized in amplitude (to 120 units here) and mixed, we get 2X f
and a DC component relative to their phase. The 2X f is filtered
out, and the DC component varies with the phase difference: it is near 0 when the
two signal paths have equal phase delay, i.e., the two received signals
are the original quadrature signals at 90 degrees. If there
is enough delay in the DUT, relative to the referance path, that the
signals are made 0 degrees apart, the DC component of the mix is maximum
positive, and when 180 degrees apart the DC is maximum negative.
Since we have to measure the input signals to set a pair
of multipliers to equalize the signals anyway, we already have a measurement
of their amplitudes. Also, although the stimulus signal levels from J48 and J49
vary with frequency, we can still plot the DUT amplitude response
by measuring it relative to the reference channel.
Anyway, here's the script
Here is a wire coax for the DUT:
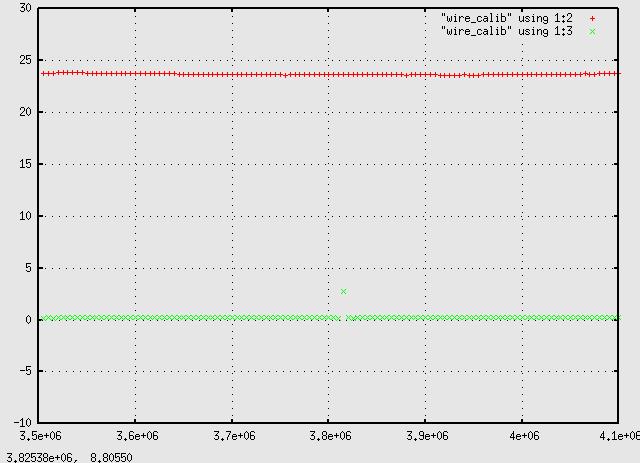
As we expect, the magnitue response, the red curve, is even across the domain, i.e.,
the amplitude of the two signals are equal, and the phase, green, is constantly
near 0, indicating the two input signals remain at 90 degrees from
3.5 to 4.1Mhz. Within about 10Khz of the center DUC/DDC frequency
the signal products get very low and 2f becomes less than 20Khz so it
becomes very expensive to filter out. For now we consider center +/- 10K
as invalid data. Some day we will just move the center frequency and retest to
get a continuous plot.
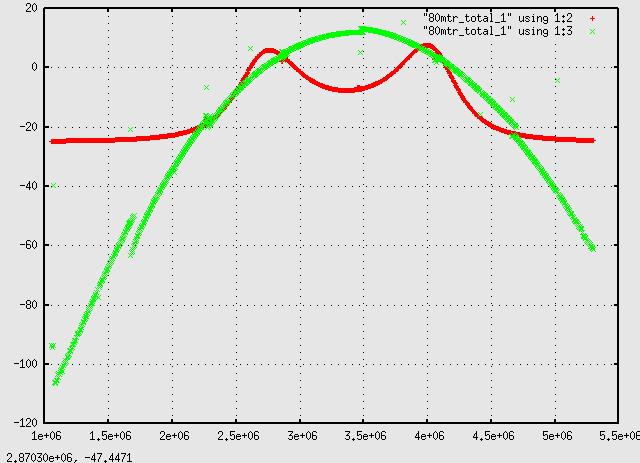
Next we connect an 80 meter bandpass filter between J48 and J19. This is
a concatenation of the data taken in 7 600Khz bands with centers at 1.4, 2,
2.6, 3.2, 3.8, 4.4 and 5Mhz.
This is the plot of magnitude and phase of the circuit simulated in SPICE3:
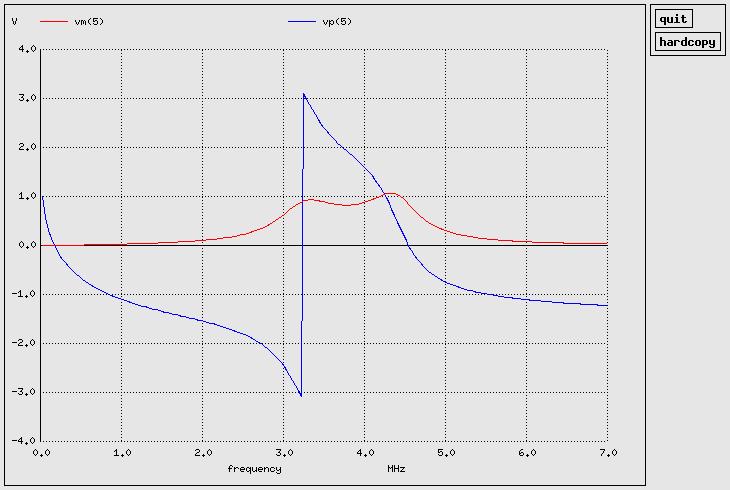
I think it's validating that where phase is "0" in the gnuradio plot, relative
to the peaks in the magnitude, is also 0 or 3.14 in the spice plot.
Again, the data is uncalibrated at the moment, as far
as absolute measurements go, but this is just to show that they do wiggle
and change reasonably and smoothly with frequency.