Directional Coupler
Supporting docs:
The Smith Chart link above leads to a wealth of information, especially see
"How Does a Smith Chart Work?" (Nelson).
Here we play with a Directional Coupler and see if it works as advertised. The
device is a Minicircuits PDC-20-3 which has 3 ports, IN, OUT and CPL. I'm going
to use it as a Reflectometer to check transmission line termination. Here is
the setup:
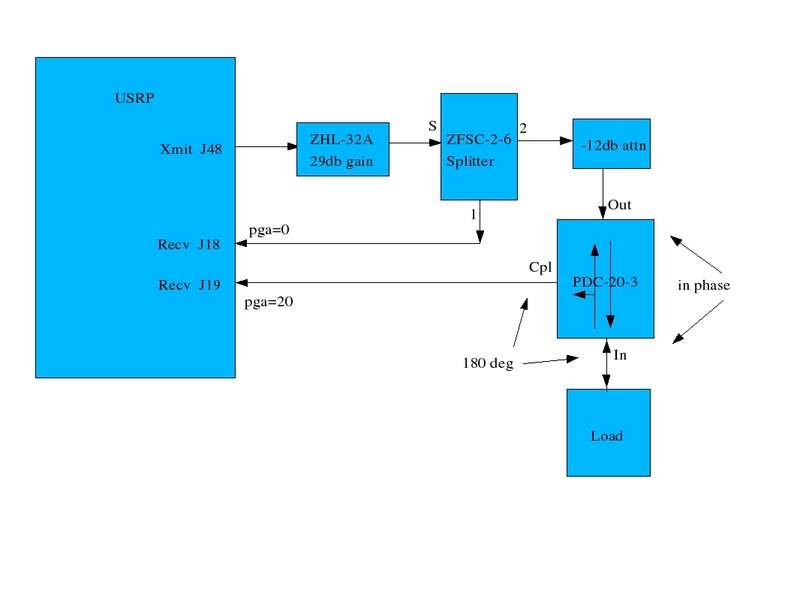
The 8-pin coupler can is mounted on a piece of perf board with some SMA connectors
and the -12db attenuation pad (3 resistors). All I'm using here is a signal
generator and an oscilloscope watching the source signal from the splitter,
and the return signal from the coupler. Since the source signal is way
bigger than the return signal we use 20db PGA gain in the USRP to get them
both visible on the scope again. Also, I notice the directional coupler
inverts the reflected signal. This wasn't mentioned in the docs but is
easily verified:
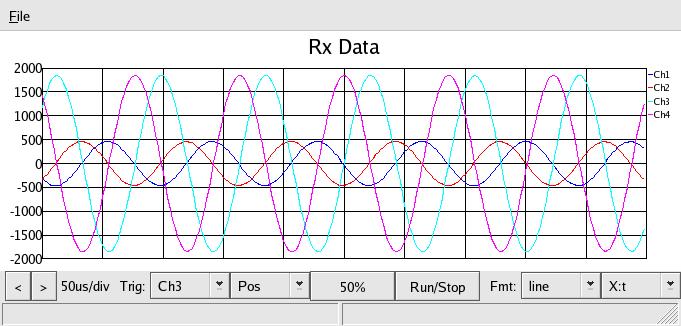
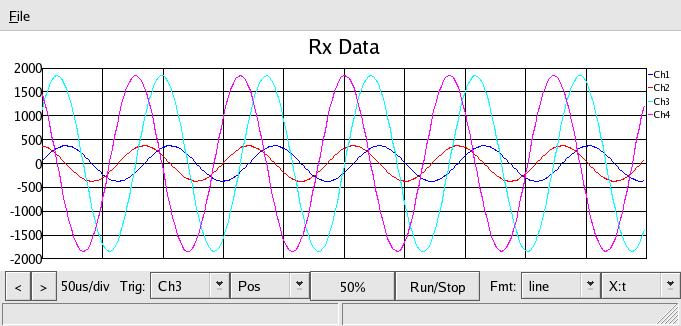
In the above I'm feeding from the splitter into the coupler IN port, a 50ohm
load on the OUT port, and measuring the CPL port in channel 1&2. In the
oscope, what is labled "channel 1" and "channel 2" is the signal on J19, or
the CPL port, and channel 3 & 4 is the source signal from the splitter.
Anyway, you can see that, for instance, ch1 & ch3 are 180 degress out of
phase, as are ch2 & 4, they cross zero at the same spot. The signal undergoes
-19db through the coupler, then +20db in the pga, and you can see it is
slightly amplified.
All these experiments are done at frequencies less than 10Mhz. In fact, at
8Mhz, the smallest lumped inductor in my junk box, 1uH, has 50 ohms of
reactance ( X = 2πfL ).
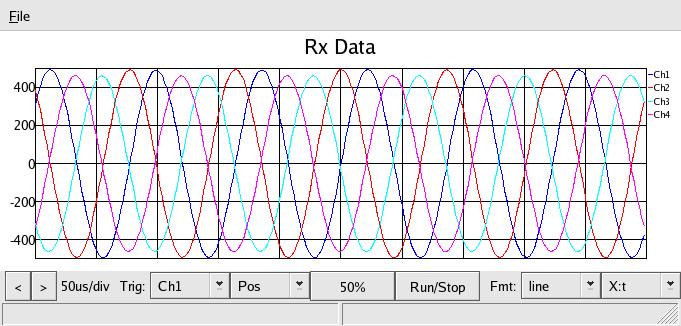
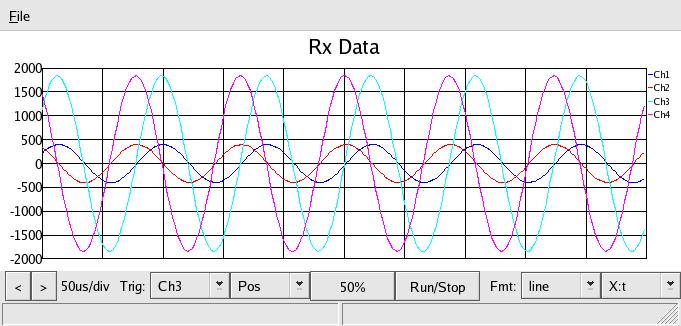
Now, wired up as in the above diagram, first look at a normal 50 ohm termination
load - it should have little reflected power:
and you can see the reflected power in channel 1 & 2 (from J19 above) is very
small. That's with a 51ohm resistor - it can be adjusted even smaller. Just
putting my fingers across it makes an even better match. This would be a point
in the very center of the Smith chart.
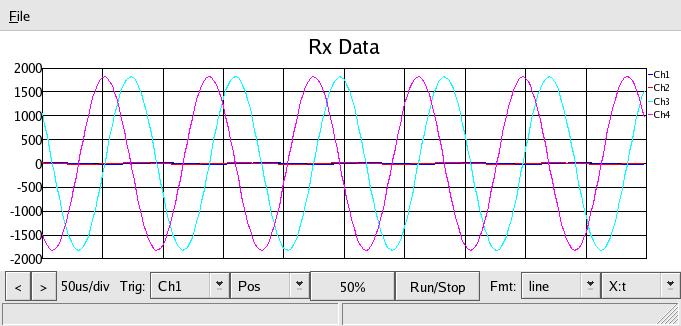
Next, an OPEN termination, or R=∞. This should reflect 100% IN PHASE, or,
since the coupler inverts the reflected signal, it should show up in the scope at
max level and 180 deg out:
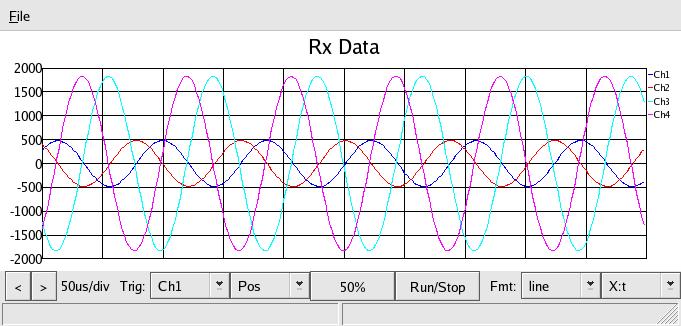
and indeed it is. This would be a point on the far right of the Smith chart.
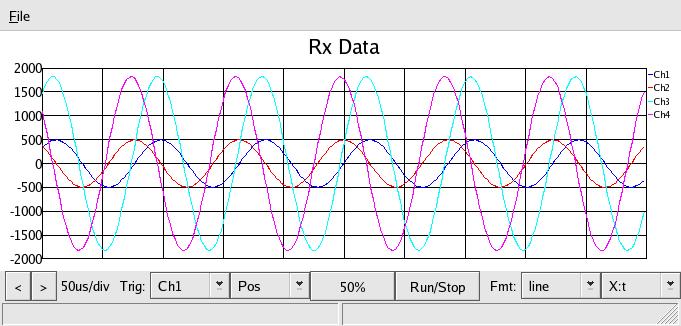
Next, a SHORTED termination - this should reflect 100% OUT OF PHASE, and
appear as in phase through the directional coupler:
In a purely resistive system, as the load varies from 0 to 250 or so Ohms, with
no reactance, the point on the Smith chart should move from the far left for
zero ohms, short circuit, towards the center - that is, remaining 180 deg
out of phase, but getting smaller and smaller in magnitude, until at 50ohms
we reach the center. As the load resistance gets larger than 50ohms the reflected
signal again gets larger and larger in magnitude but now is in phase. This
behavior matches the formula for reflection coeffecient: Γ = (Zl - Zo)/(Zl + Zo)
where Zl is the load impedance and Zo the transmission line impedance. If Zl is less
than Zo, Γ is negative and tends toward -1 as Zl approaches zero. If Zl is
greater than Zo, Γ is positive and tends toward 1 as Zl approaches infinity in a purely resistive system.
Also, we now know experimentally what the maximum reflected power is - looks
like about 500 on the scope. Theoretically, the reflected signal, relative
to the reference from the splitter, is going through -12db in the attenuator.
100% is being reflected in the open and short circuit termination, and -19db
of the reflected power is fed to the CPL port, with the rest applied to the load side of the
attenuation. The reflected power sample then gets +20db gain in the USRP pga.
That's -12-19+20 = -11db.
The source signal appears to be about 1800 on the oscope above.
-11db of 1800 as a VOLTAGE ( using db = 20*log(v1/v2) is 452.
For the next experiment, I want a point at the top of the Smith chart,
where R=0 but X = 1 Inductive ( Z = 0 + 1j). Since the system Z is 50,
that would be an inductive reactance of 50 = 2 * π * 3.9e6 * L, or
L = about 2uH. Plugging a couple of 1uH inductors in series for a load,
I get this response:
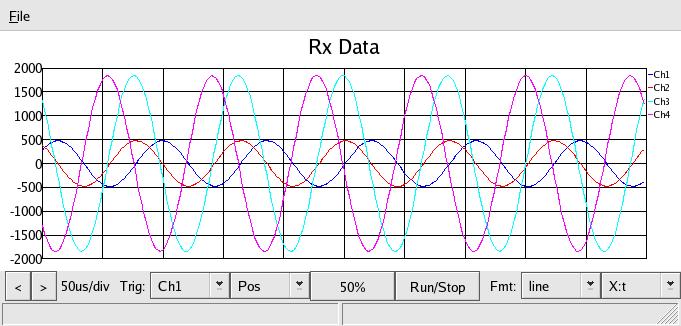
Above, we get the max R=0 amplitude corresponsing to the outer ring of
the Smith chart, and looks like the +90 deg phase shift (advance) of the
reflected power (remember, the reflected power is phase inverted - look
at the open signal above and advance (move to the left) the reflected
signal by 90 deg, to match this one).
Finally, just the opposite to collect all four corners of the compass, let
X = 50 capacitive, or 50 = 1 / ( 2* π * f * C ) or C = 0.001uF,
at 3.9Mhz, which is a common value. Plugging it in, we get:
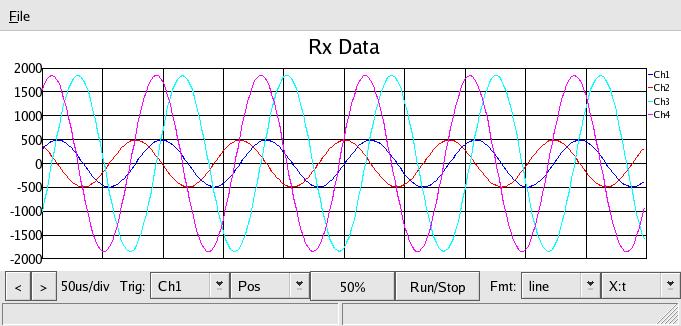
Which shows a nice, almost -90 deg delay (shift to the right) of the reflected
power, at the R=0 amplitude. At this point, since we have shown the
response to be as expected, or at least we know WHAT to expect for known
values, we can now measure the phase and amplitude of a reflected signal
and calculate the appearent impedance of any load.
More ideas - since we have X(l) and X(c) both = 50 we can try some
combinations. Putting both in series we should have a Series Resonant
circuit at f=3.9Mhz:
Which should appear as a short circuit, R=0, with the reactances cancelling out,
like the scope of a short above. Well, you can see there is some error, the
lines don't cross right at zero, and looks like there's not enough advance.
To advance LEFT around the Smith chart, keeping R=0, we use LESS inductance.
Look at the chart - more inductance gives you less phase shift, less inductance
gives more. Makes sense when you remember that Z=∞ gives NO phase shift. So I put a 1.5uH in place of the 2uH:
Now that looks like the short circuit, altho R looks to be something more than
zero with the diminished magnitude.
Then, we can try putting them in parallel, which should look like an open
at f=3.9e6 (again using the 1.5uH):