Automatic Testing - Sweep Generator
Here we use the full-duplex capability of the usrp to generate
a test signal and read the results. Specifically, we will sweep
a constant-amplitude frequency across a band and measure the
amplitude of the input. We can get a baseline measurement of
performance with a coax-wire loopback, and then put in filters
etc. to get their frequency response.
Here is the script which needs to find
usrp_siggen.py ( from gnuradio-examples-0.5.tar.gz, newer
gnuradio-example siggen's do not have a 'siggen' class).
You specify the filename to log the results in and get data suitable
for gnuplot. It no longer needs custom blocks to read a signal level.
Instead we now use gr.probe_avg_mag_sqrd_c() from the gnuradio source.
Also added a square-root so are reading the RMS of the signal, not
the magnitude-squared like the earlier version (ate_1.py). It might
be more convenient to leave it "mag squared" for comparing power
instead of voltage (p=v**2/r or i**2r) or multiply log10 by 20
for getting correct db gain or loss values.
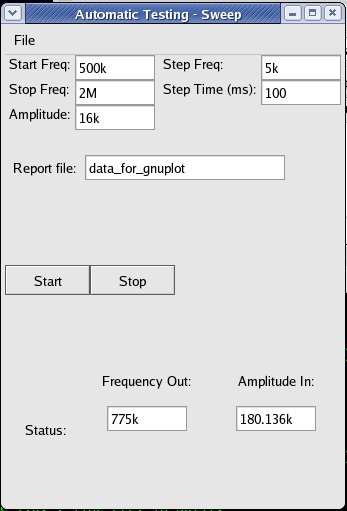
Values to sweep the AM broadcast band (500khz to 2Mhz) are already
in place with 100ms between samples, to allow for a conservative
settling time for each measurement. Enter values you want in the
text controls or just change the script to your band of interest.
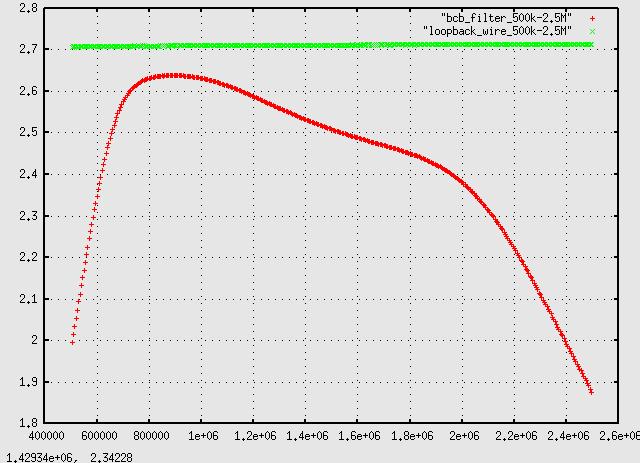
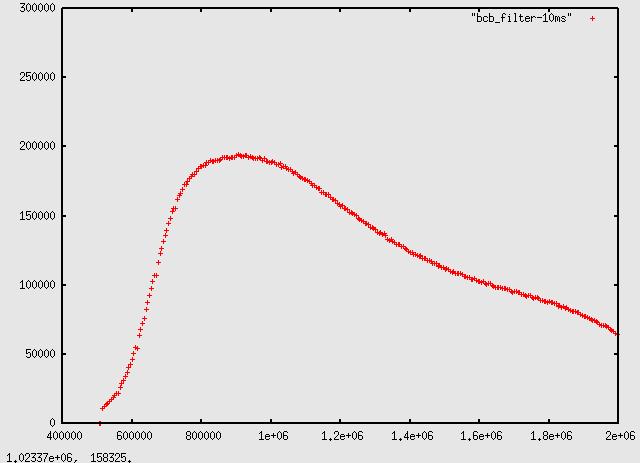
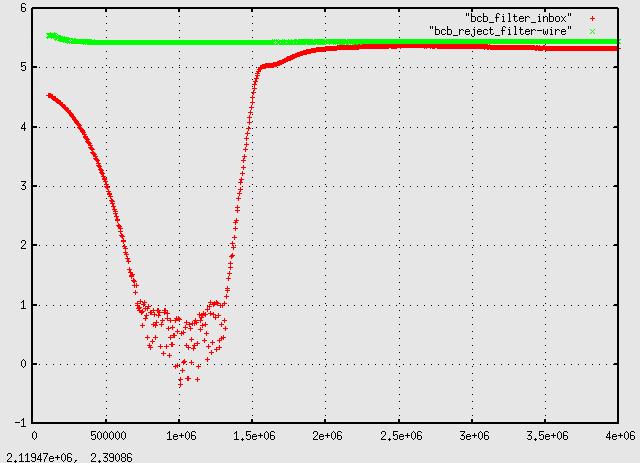
Here is a recent plot of the broadcast bandpass filter:
All plots below are from the older version with magnitude-squared.
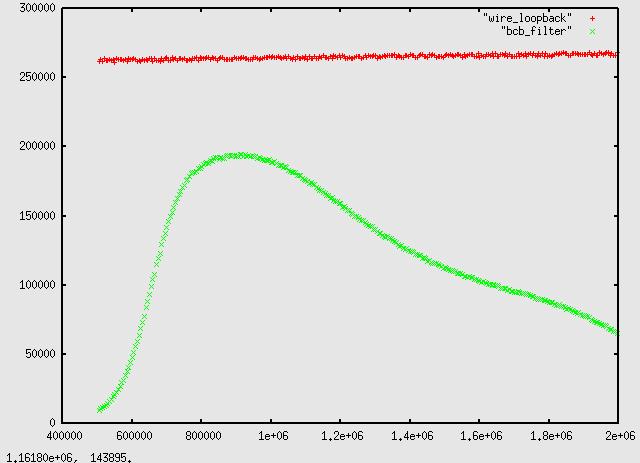
Here is our first plot of a loopback cable (red) and a bandpass filter
(green) - these are linear values and would look more meaningful
in a log/log plot:
And the next plot is trying to speed up the process using only
10ms between samples - much faster and largely the same but a few
data points are out of place - the first two are zero and it looks
like about one every 10 after that are stale values.
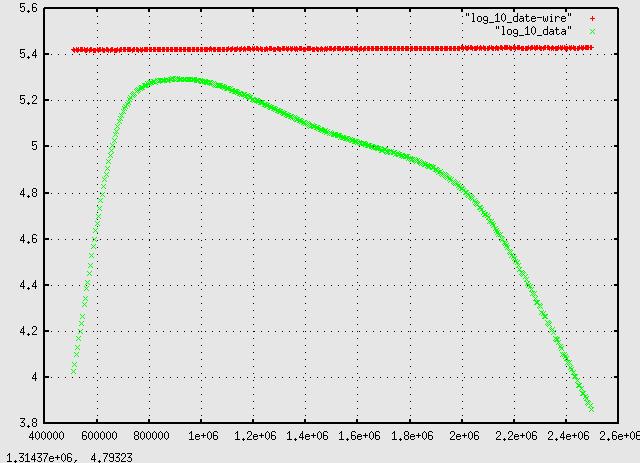
This is a better view of the filter, using a log10 scale for the Y
axis and going out further to see the upper knee:
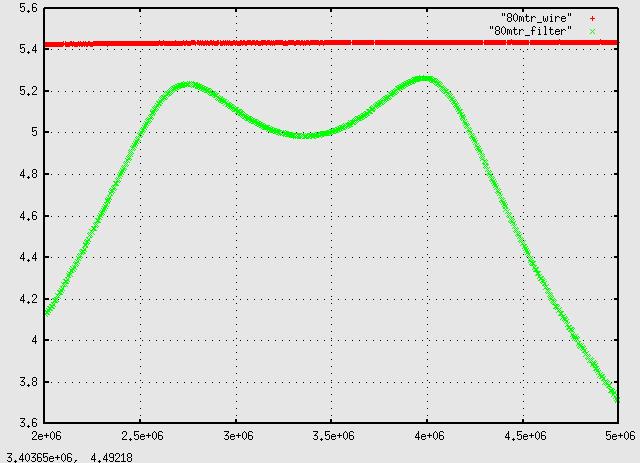
Here's some more real, analog filter plots, an 80mtr ham bandpass
filter (from here, everything between and including L1 to L2):
A high-pass AM BCB stop filter, for swl'ers near strong AM stations
(schematic here):
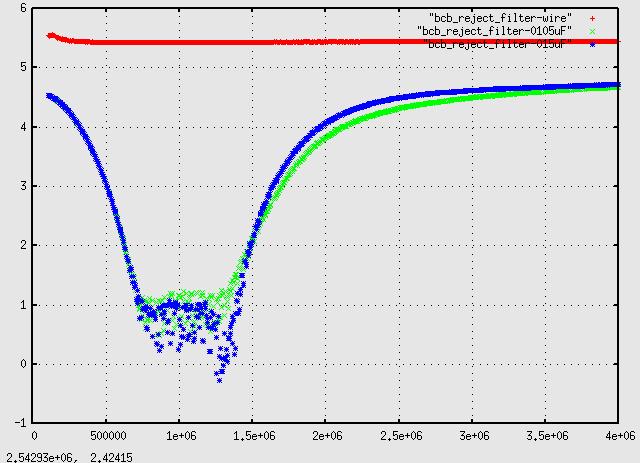
While getting ready to move this circuit from a breadboard to a permenant box I noticed a 560pf capacitor
was where at 5000pf should be (paralled with a 0.01 to get near 0.015uF). The
above plot was made, while still on the breadboard, out of curiousity over what effect that has on the filter
and indeed, the closer to spec part results in the better looking blue curve.
The next plot was made after soldering the parts onto a perf board and
mounting in a box:
It's amazing what effect rearranging the exact same parts and soldering them
together had, especially on improving the insertion loss!
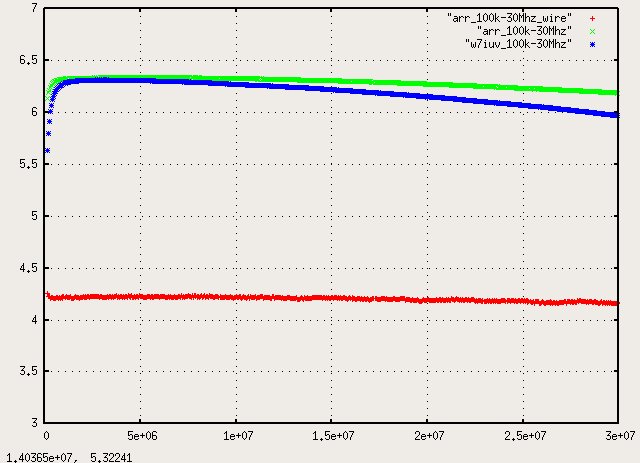
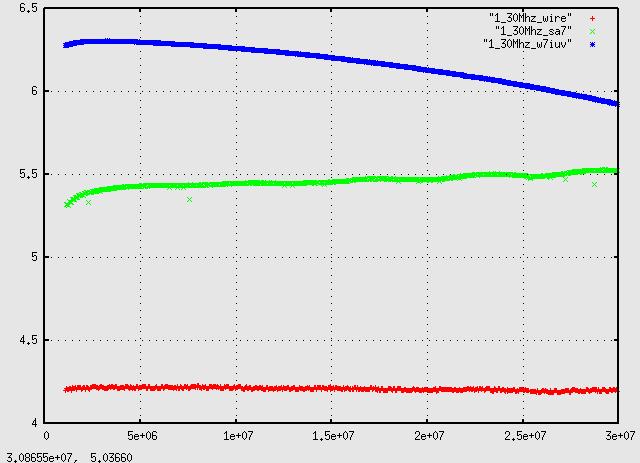
Comparing some amplifiers - red line is a straight wire, green is the
Ramsey SA-7 preamp kit, advertised as 20db gain but we may have an
issue with Z-matching to the RG-174 cables - and the blue is a nice
W7IUV single transistor amp doing it's expected ~18-20db gain. X Range
is 1-30Mhz, and Y is log10 of 'magnitude squared' - so it
would be in 'bels', *10 for decibels. That is, at the lower frequencies,
the blue curve is about 2 bels (6.2 - 4.2) gain over the wire, so that's about 20db
gain, dropping to 18db around 27Mhz.
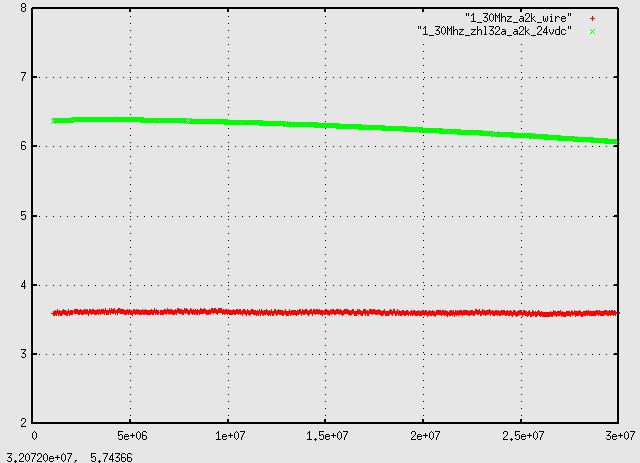
Here's the Minicircuits ZHL-32A, the best amp I have, as well
as the most expensive. Look like around the advertised 28db gain:
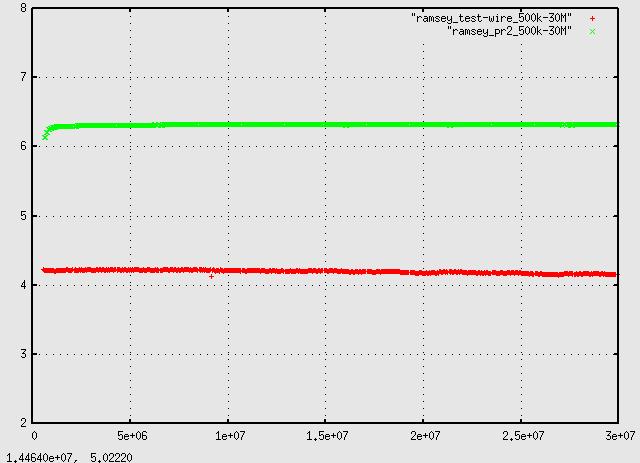
They don't get much flatter than this - just added a Ramsey PR-2 to the
collection:
These are my first RF stage, a W7IUV amp,
recently replaced with a commercial built Advanced Receiver Research
P0.5-30/20VD, both showing about 20db gain. Both are bipolar transistor units with an output transformer.