Fourier transfer of sinc function - rectangle
We know that a nice sharp rectangle shaped filter
uses sinc { sin(x)/x } shaped filter coefficients:

Here we try another approach and look at the fourier transform of a sinc function.
Here's the code:
#!/usr/bin/env python
#

from gnuradio import gr
from gnuradio import eng_notation
from gnuradio.eng_option import eng_option
from gnuradio.wxgui import stdgui, fftsink
from optparse import OptionParser
import wx, math

class app_flow_graph (stdgui.gui_flow_graph):
    def __init__(self, frame, panel, vbox, argv):
        stdgui.gui_flow_graph.__init__ (self, frame, panel, vbox, argv)

        self.frame = frame
        self.panel = panel

	sampling_freq = 2e6

	x=0.
	vec = []
	for k in range(-710.,710.):
	  if (math.pi * (k/7.)) == 0:
	    x = 1.
	  else:
	    x = math.sin(math.pi * (k/7.))/(math.pi * (k/7.))
	  vec += [x]

        self.u = gr.vector_source_f (vec,1)

#	probe1 = gr.file_sink (gr.sizeof_float, "sinc")
#	self.connect (self.u, probe1)

        block, fft_win = fftsink.make_fft_sink_f (self, panel, "", 512, sampling_freq)
        self.connect (self.u, block)
        vbox.Add (fft_win, 1, wx.EXPAND)


def main ():
    app = stdgui.stdapp (app_flow_graph, "USRP FFT")
    app.MainLoop ()

if __name__ == '__main__':
    main ()
which produces this plot:

Conversly, a rectangular wave produced by this code (and switching to complex to better enjoy the symmerty):
#!/usr/bin/env python
#

from gnuradio import gr
from gnuradio import eng_notation
from gnuradio.eng_option import eng_option
from gnuradio.wxgui import stdgui, fftsink
from optparse import OptionParser
import wx, math

class app_flow_graph (stdgui.gui_flow_graph):
    def __init__(self, frame, panel, vbox, argv):
        stdgui.gui_flow_graph.__init__ (self, frame, panel, vbox, argv)

        self.frame = frame
        self.panel = panel

	sampling_freq = 2e6

	vec = []
	for k in range(0,500):
	  vec += [0+0j]
	for k in range(501,511):
	  vec += [1+1j]

        self.u = gr.vector_source_c (vec,1)

#	probe1 = gr.file_sink (gr.sizeof_float, "sinc")
#	self.connect (self.u, probe1)

        block, fft_win = fftsink.make_fft_sink_c (self, panel, "", 512, sampling_freq)
        self.connect (self.u, block)
        vbox.Add (fft_win, 1, wx.EXPAND)


def main ():
    app = stdgui.stdapp (app_flow_graph, "USRP FFT")
    app.MainLoop ()

if __name__ == '__main__':
    main ()
produces this plot:
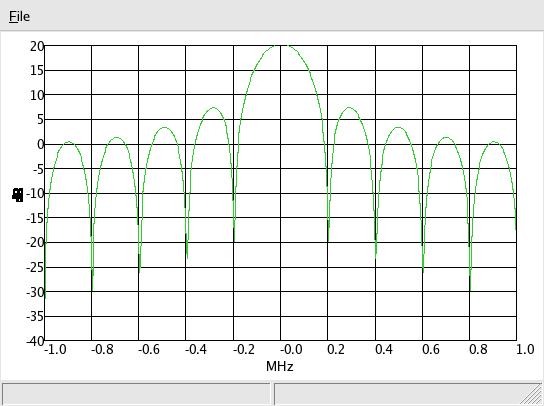
which is similar to the magnitude of the sinc function:
