Exploring DFT
Now that we have dft working lets look at a few simple contrived
cases to see that it's doing what we learned in school.
First is a constant sine wave which should return a peak in the dft
output. Trying 600hz, the code:
	sample_rate = 32000
	fft_size = 1024

        src = gr.sig_source_c (sample_rate,gr.GR_SIN_WAVE,600,1,0)
        s2p = gr.serial_to_parallel (gr.sizeof_gr_complex, fft_size)
        fft1 = gr.fft_vcc (fft_size,True,True)		# forward, windowing on
        p2s_1 = gr.parallel_to_serial (gr.sizeof_gr_complex, fft_size)
        fft_1 = gr.file_sink(gr.sizeof_gr_complex, "fft")
        fg.connect ( src, s2p )
        fg.connect ( s2p, fft1 )
        fg.connect ( fft1, p2s_1 )
        fg.connect ( p2s_1, fft_1 )
When run we get this output:

Since we are using an fft window size of 1024 the above is many windows in
a range of 20000. Focusing on the first 0-1023 window:
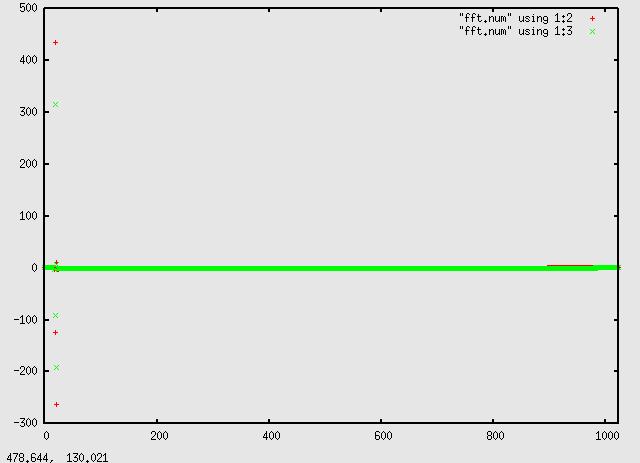
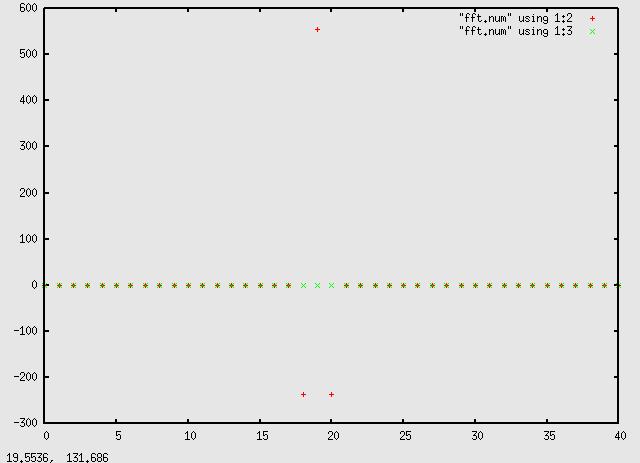
shows one peak in the far left. Focusing in on that:

we see the peak is about point 19. Out sampling rate is 32000, and the fft
window is 1024, so each point is 32000/1024 = 31.25hz. Multiplying
19 * 31.25 is 593.75, very close to our input signal. Adjusting the signal
to an even 'bin' frequency of 593.75, we get a more symmetrical peak:
and each 1024 sample 'window' has the same symmetrical peak, as opposed
to the first plot where each has a different shape due to different phase
within the window.
Indeed you can change the input signal frequency to anything from a few
hz to 16Khz and move the peak up and down the spectrum, just as expected.
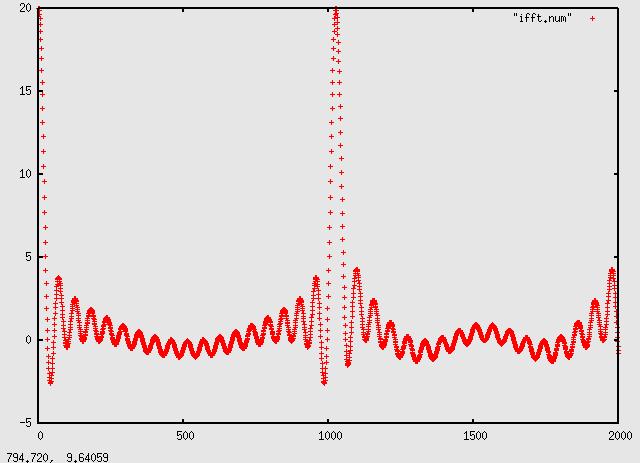
Next we create our own spectrum with a peak at 19 and do an inverse
dft transform. The code:
        sample_rate = 32000
        fft_size = 1024


        vec = []
        for i in range(0,19):           # 0 to 18
          vec += [0]
        vec += [1+0j]                   # 19
        for i in range(21,1024):        # 20 to 1023
          vec += [0]

        src = gr.vector_source_c(vec, 1)
        s2p = gr.serial_to_parallel (gr.sizeof_gr_complex, fft_size)
        ifft1 = gr.fft_vcc (fft_size,False,False) # inverse, no windowing

        p2s = gr.parallel_to_serial (gr.sizeof_gr_complex, fft_size)
        ifft_out = gr.file_sink(gr.sizeof_gr_complex, "ifft")

        fg.connect ( src, s2p )
        fg.connect ( s2p, ifft1 )
        fg.connect ( ifft1, p2s )
        fg.connect ( p2s, ifft_out )
which returns this nice cosine wave with 54 points/cycle, or about 592Hz at
32000 sample rate:

Finally, the point of this operation, to do an inverse DFT on a rectangle
to create sinc functions. The code, same as above except to create our
input spectrum vector:
        vec = []
        for i in range(0,19):           # 0 to 20
          vec += [1]
        for i in range(20,1024):        # 21 to 1023
          vec += [0]
which produces this beautiful output:
Math: According to the paper referenced here,
"Note that a pulse of width t has the bulk of its energy contained in the main lobe, which spans a one-sided bandwidth of 1/t Hz." Our pulse width here is 20/32000 = 625uS, so the main lobe bandwidth should be 1600Hz. Estimating the width above
near the bottom is something around 1050-995=55 bins. Recall each bin is 32000/1024=31.25 (sample rate / fft width), and indeed 55*31.25=1718.75. Moral of story, narrower pulses use wider bandwith.
Below, using a narrower rectangle pulse gets a wider sinc function. Using 10
instead of 20:
