Finite Impulse Response to Impulse Noise
Next we'll look at the response of a FIR filter to impulse noise using
this code:
	sampling_freq = 4e6

	fg = gr.flow_graph ()

	src = gr.noise_source_f ( gr.GR_IMPULSE, 1, 2895)

	# compute low pass filter taps
	lpf_taps = gr.firdes.low_pass ( \
		1.0,	# gain
		sampling_freq,
		2e6,	# cutoff frequency
		500e3,	# transition band width
		gr.firdes.WIN_HAMMING )

	# print taps
	for a in lpf_taps:
	   print a

	filter = gr.fir_filter_fff ( \
		1,	# decimation: none
		lpf_taps )

	dst_i = gr.file_sink (gr.sizeof_float, "impulse_noise")
	dst_o = gr.file_sink (gr.sizeof_float, "impulse_response")

	fg.connect (src, dst_i)
	fg.connect (src, filter)
	fg.connect (filter, dst_o)
For the first run we have the LPF cutoff freq = the samplying Nyquist freq:
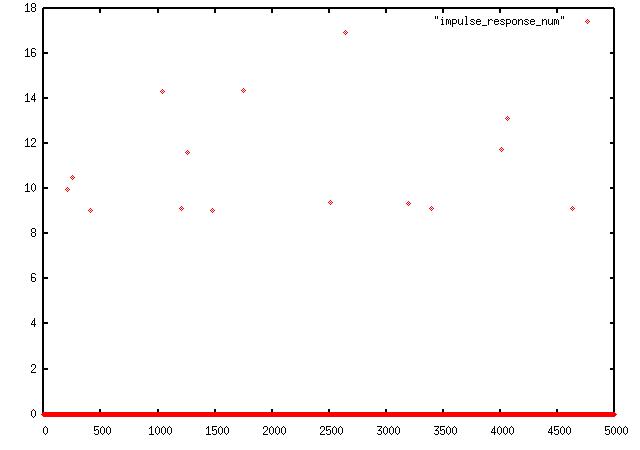
here you can see no discernable filtering taking place at all since the filter is passing
everything that the sampling rate bandwidth allows. In fact, if we look at
a plot of the filter taps we see an impulse:

Now we will change that cutoff freq to something more intereting, like 266Khz, with a sharper transition band:
	lpf_taps = gr.firdes.low_pass ( \
		1.0,	# gain
		266e3,	# cutoff
		50e3,	# transition band width
		gr.firdes.WIN_HAMMING )
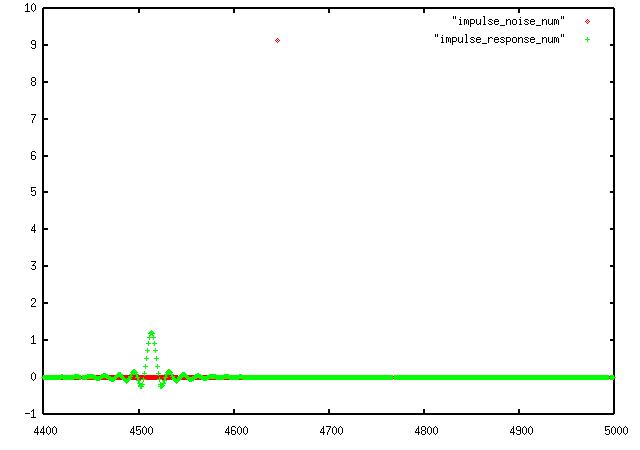
where you can see the classic sin(x)/x shape in green with the impulse the red
dot up at 9 near the center about 4650. But why does the response occur before the stiumlus?
This puzzled me for a minute untill I realized the green filter chart is delayed by the number of filter taps. The red input curve begins as soon as the program starts, but the filter doesn't have any output until # of taps later, so
the impulse actually
occus at the very left of the response curve, instead of the very right.
The number of taps here is 265, and they look just like the impulse
response:
